Do you have a website but are unsure of how well it's performing? Are you struggling to understand the metrics and data that can help you track its success? Tracking website metrics is crucial for understanding your audience, improving user experience, and ultimately achieving your online goals.
In today's digital age, having a website is essential for any business or organization. However, simply having a website is not enough. You need to continuously monitor and analyze its performance to ensure it is meeting your objectives. This is where website metrics come into play.
Website metrics provide valuable insights into how your website is performing and how users are interacting with it. By measuring and tracking these metrics, you can make informed decisions to optimize your website and drive better results.
In this article, we will explore some of the key website metrics that you should be measuring and tracking to ensure the success of your online presence.
|
Website Development Website development is a catch-all term for the work that goes into building a website. This includes everything from markup and coding to scripting, network configuration, and CMS development. |
Defining Website Metrics
At its core, a website metric is a quantifiable measure used to gauge specific aspects of a website's performance. These metrics provide actionable insights into user behavior, engagement levels, and the overall effectiveness of your online presence.
From visitor interactions to conversion rates, website metrics serve as the compass guiding your digital strategy.
Website Metrics: A Dive into Digital Performance
In the ever-evolving landscape of online presence, understanding the pulse of your website's performance is paramount. Enter the realm of website metrics—a multifaceted array of data points that offer a nuanced perspective on how your digital presence resonates with your audience.
Let's unravel the essence of website metrics and explore why they are crucial for any online venture:
1. Number of Website Visitors
Before you can gauge how attractive, engaging, and useful your website is, you need to know how many people are viewing it. This is called the "number of visitors."
If the numbers are too low, the other metrics covered here won't be useful, so you must attract traffic.
You can create content for your site that ranks well on search engine results pages (SERPs) so that people who type relevant keywords into Google see your page when they search for them. You can use link-building techniques to gain backlink popularity by posting links to your website from other sites with similar audiences.
You can also increase traffic by advertising on Google Ads, Facebook, or other popular social media sites.
If you already have an established website that gets lots of visitors, you should measure the number of returning visitors.
Return visitors are those who've previously viewed your site. Having lots of return visits indicates that your site has good quality content.
If you don't already have a large volume of return visitors, you can:
- Create more engaging posts like infographics and videos.
- Improve your product page by adding more products, making them look more attractive, and including video content.
- Find out which demographics best need your business solutions.

2. Bounce Rate
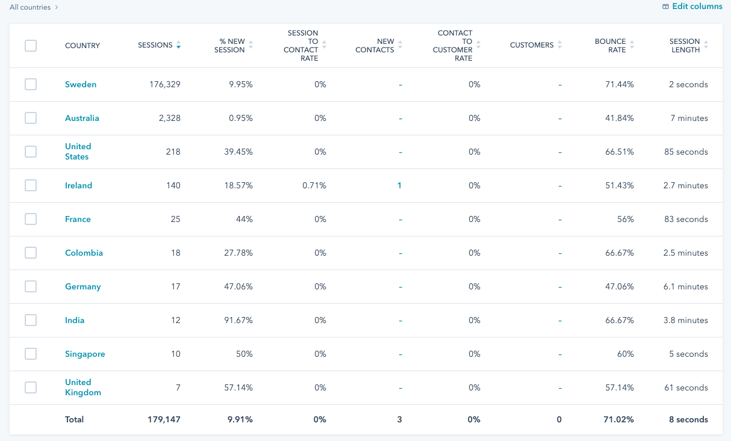
A bounce occurs when a visitor loads a web page, sees something interesting, and leaves without clicking anything. This could happen because the visitor didn't find what he/she was looking for, or because the visitor found something else that caught his/her eye.
If you want to know how many visitors are interested in your product or service, you'll want to keep track of bounces. You can do this by tracking the number of visitors who land on your site, see something interesting, and leave immediately.
The bounce rate metric tells you whether your current marketing efforts are working. If you've got a high bounce rate, chances are people aren't finding what they're looking for.
On the flip side, if you've got a low bounce rate, you're doing something right!
3. Average Pageviews per Session
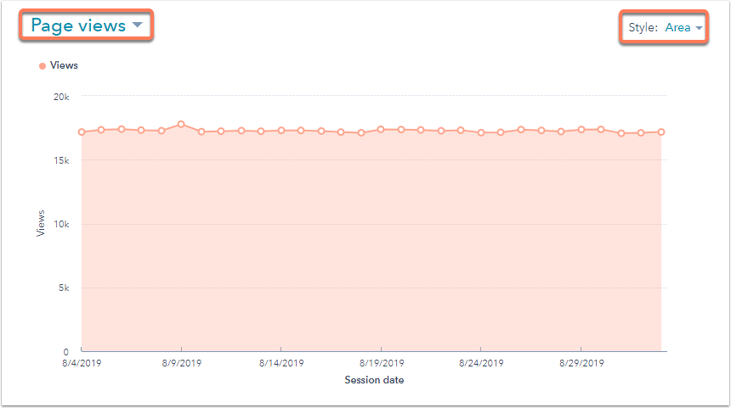
If you’re looking to increase traffic to your website, one of the best metrics to track is average page views per session. This tells you how many pages a typical visitor looks at while browsing your site. You can use this information to determine what pages are most popular among your audience.
For example, if someone visits three pages on your site during a given session, there’s a chance they’ll come back later and spend more time on your site. In addition, if you find out that a certain page gets 10 times more traffic than another page, you might consider optimizing that particular section of your website.

4. Session Duration
The session duration metric is easy to understand. It calculates how long a visitor spends on your site. This metric helps you see whether your visitors are spending too little time on your site or too much time on your site.
This metric doesn't tell you anything about how engaged your audience is with your content. For example, if someone visits your website, reads one article, and leaves immediately, it could indicate that he or she wasn't interested in what you had to say. Or, it might mean that he or she didn't find what he or she wanted. In either case, the fact that a person visited your site for a short time isn't necessarily a good thing.
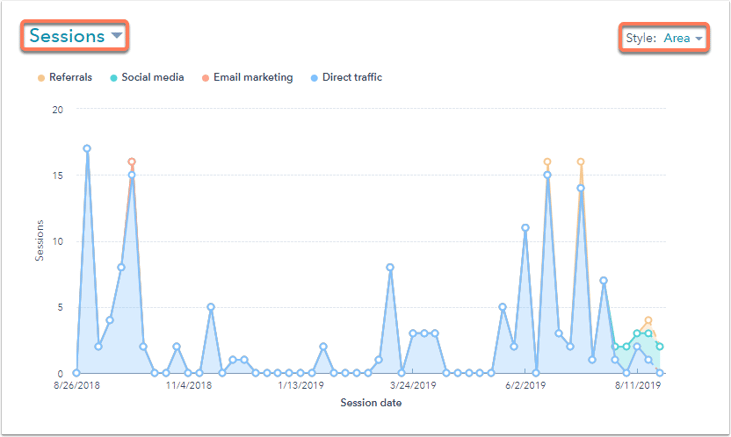
If a user is inactive for more than half an hour, Google Analytics considers that user session closed. Therefore, if you're looking at a graph showing the number of sessions over time, you'll want to look at the trend lines rather than the actual numbers.
If your site is primarily designed to showcase your products and/or service offerings and is dependent upon visitors exploring your pages and clicking through to them, then user session duration might be an excellent indication of how interesting visitors find your site.
On the one hand, if you post long-form content on your website, your readers may not click through to any of your pages. In that case, this would not be an accurate measurement of page engagement.

5. Average Time on Page
If you were to think about just the number of visits and page views, you would only get half of the story. You might see a high number of visits, but if those visits lasted less than 5 seconds, no one is likely to read anything on the site.
The metric that shows your actual interaction, when considered with average visit duration, is the average time on site. The average time on site gives you insight into how long visitors spend on each page of your site. This helps you understand what types of pages are most popular, and where you should focus your efforts moving forward.
For example, if you notice that certain sections of your site tend to receive much longer visits, such as product reviews, check out the average time on page for those particular pages. You can use this information to determine whether there is a problem with the way the review section is structured, or if it’s simply attracting fewer browsers overall.
Average time on a page will help you identify which pages are getting the most traffic, and which ones aren’t. For sites that are primarily focused on video or text content, it’s important to pay attention to the average time on site because it tells you how many minutes per visitor are spent viewing your content.
6. Top Traffic Source
There are places your website visitors came from, and we're certainly not talking about their hometowns anymore. We're referring to the specific place where they found out about your website. This could be because they saw a link on social media, someone recommended it to them, clicked a banner ad, or typed it into a browser address bar. These locations are called traffic sources.
Traffic sources are important because they help you understand where your site traffic is coming from and how effective your campaigns are. If a visitor comes to your site from Facebook, that tells us something about what type of content appeals to them there. If they come from Pinterest, it might mean they like visual design. And if they come from Twitter, it might mean they follow brands.
For example, your organic traffic will likely increase as you continue to grow your inbound marketing efforts.
The more traffic sources your site gets from, the better. A high number of unique visitors coming from different places gives you a fuller picture of what types of content appeal to your audience.

7. Device Source
Device source is another metric you might want to consider when optimizing your website. This metric allows you to know what type of device is accessing your website.
For example, if you notice that mobile traffic accounts for 10% of your total visits, you can start thinking about how you can improve your mobile experience. If there are certain features or elements on your website that aren't working properly, you can fix those issues immediately.
You can also think about adding some special elements for each device. Maybe you'd like to add different images for desktop vs. mobile visitors. Or maybe you'd like to show videos differently depending on whether the visitor is viewing on a laptop or a phone.
8. Interactions per Visit
Another interesting metric to keep track of is the number of interactions per visitor. It gives you an idea of where people spend most of their time on your site, allowing you to focus your efforts there.
You could use analytics tools to figure out which product categories get the most traffic from your site. Knowing this will help you know what kinds of products your visitors want to see.
You can use the Interactions Per Visit metric to see exactly which links, buttons, or other interactive elements visitors click on and what actions they take (like liking a post, subscribing to an email list, commenting on a blog post, etc.)
With all this data at hand, you can plan your content or marketing strategies better, and increase your subscribers or boost your engagement.
9. Exit Pages
Some websites have a multi-step conversion process. For example, if your site sells products through content marketing, you might first need readers to visit your blog. Then you'll need them to sign up for your email newsletter.
Visitors may need to click on a "purchases" link from an e-mail they receive, and then complete a form, and so forth.
If they're looking at an eCommerce site, maybe their first step is to enter some keywords into the search box or scroll through the extensive categories before clicking on the "checkout" button.
Multi-step processes like these often involve visitors falling out at some point during the entire experience. It could be because the whole thing is too complicated for them or simply because they've changed their minds.
To improve your site's conversion rate, you first need to identify which of your web pages are exit points, meaning they're leaving your website without completing their purchase.
By doing so, you'll be able to identify which parts of your site need improvement to enhance user experience or reduce friction.
10. Conversion Rate
Another crude top-level key metric is conversion rate. It can be argued that it’s the most essential metric for a website because it can have a huge effect on its bottom line if you can improve it. If you can improve your conversion rate by 10%, your earnings double.
Conversion rates are important, but it’s the conversion rate that lets you know whether you're encouraging people to take the desired actions.
To calculate your conversions, divide unique visitors by conversions.
You can also use Google Analytics to see how your conversion rates change over time.
Conversion rates vary by website and may include multiple conversion "goals." An eCommerce website might have three conversion "goals": sales, signups, and conversions.
- A sale
- An email subscriber
- Social shares (the least important, but still useful)
The higher your conversions, the better your website's performance is. Low conversions indicate that you're attracting the wrong visitors, your CTA is weak, and/ or your marketing copy isn't effective.
As your conversion rates can have such a significant influence on your profits, you should be continuously optimizing your site for conversions—even small changes can have a major effect on your bottom lines.
Start Measuring Website Performance
To use these measures correctly, you need to identify which ones can help you determine whether your site is meeting the needs of the business.
If you try to improve every metric at once without any clear digital marketing goals, you'll soon be overwhelmed by the number of metrics you need to track and obsessively focus on improving them.
Instead, focus on understanding the metrics you're collecting so that you can generate insights that you can use to improve the user experience on your website.
We also recommend testing variations of webpages by running A/B tests in HubSpot or using Google’s Optimize. By creating multiple variations of your page, tracking which ones perform best, and analyzing the results, you can learn what works well, and what doesn't, so that you can improve your site.
Most of these metrics can be optimized by ensuring content relevancy, optimizing technical SEO aspects, such as Page Speed, and having a coherent, intuitive design.
Which metrics are you tracking on your website?
At Fine Media, we design beautiful websites that your customers love, but most importantly we design lead-generating machines. If you want a website that generates leads and grows your business, contact us.


