In a world where everything is going digital, how important is it for businesses to have an online presence? And, how effective is digital marketing in reaching potential customers?
Digital marketing has become a crucial part of any business strategy, with more and more people spending their time online. But, what are the facts and figures that support this trend? What are the latest digital marketing statistics that every business owner should know?
In this article, we will explore the latest digital marketing statistics that every business owner should be aware of. From the number of social media users to the effectiveness of email marketing, we will dive into the data that will help you make informed decisions about your digital marketing strategy.
So, let's get started and take a closer look at the numbers behind digital marketing.
|
Digital Marketing Digital marketing is advertising delivered through digital channels to help promote brands and connect with potential consumers. |
General Digital Marketing Statistics
In the ever-evolving world of digital marketing, staying informed about the latest trends and statistics is crucial for businesses to succeed. This section provides key insights into general digital marketing statistics, covering areas such as ad spending, mobile dominance, the impact of organic search, customer reviews, and more.
By understanding these statistics, marketers can make informed decisions and leverage digital marketing strategies to maximize brand visibility, engage with their audience, and drive conversions.
Let's explore these important statistics that shape the digital marketing landscape.
- The Digital Marketing industry is predicted to reach $807 billion by 2026.
- Desktop takes 39% of the share in ad spending as of 2023, while smartphones take the remaining 61%.
- By 2026, desktops will have 31% of the ad spending share, and mobile phones will have 69%
- Non Programmatic ad spending holds a mere 16% share in 2023, while programmatic holds 84%.
- 49% of marketers say that organic search has the best ROI.
- 20% of businesses say they measure Digital Marketing's success by measuring the number of leads generated.
- 72% of the marketing budget goes towards Digital Marketing, according to a survey from Gartner.
- Google process8.5 billion searches each day as of 2023.
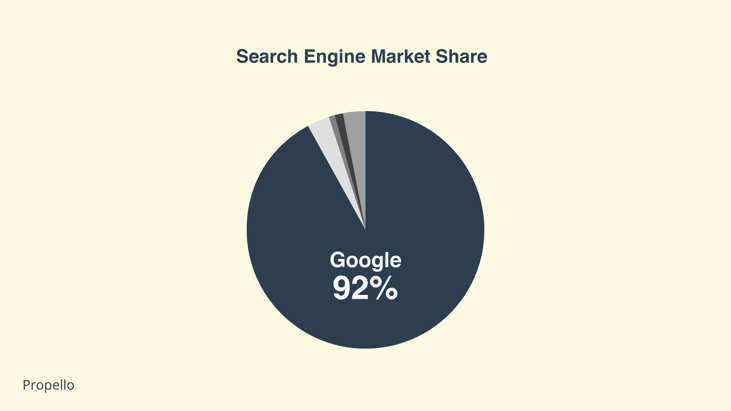
- Google is the world's biggest search engine catering to 92% of global searches.
- The marketing job demand is set to increase by 10% by 2026 as per a survey by the Bureau of Labor.
- Customers spend 50% more with businesses that respond to reviews at regular intervals.
- Over 90% of people read reviews online before making a purchasing decision.
- Digital Advertisements can increase a brand's awareness by 80%
- 62% of marketers use software for Customer Relationship Management.
Digital Marketing Industry Statistics
The digital marketing industry is a rapidly growing and highly influential sector that plays a crucial role in the success of businesses worldwide.
In this section, we will explore key statistics that highlight the significant impact and potential of digital marketing strategies. From the exponential growth of the global market to the impressive returns on investments, these statistics shed light on the evolving landscape of digital marketing.
Whether it's the rise in digital advertising spending, the effectiveness of email marketing, or the power of online reviews, understanding these statistics is essential for businesses aiming to thrive in the digital realm.
Let us as we delve into the fascinating world of digital marketing industry statistics.
- The global digital advertising and marketing market was estimated at $350 billion in 2020 and is projected to reach $786.2 billion by 2026.
- The U.S. digital advertising and marketing market is currently estimated at $460 billion.
- The compound annual growth rate of digital marketing from 2020-2026 is projected at 9%.
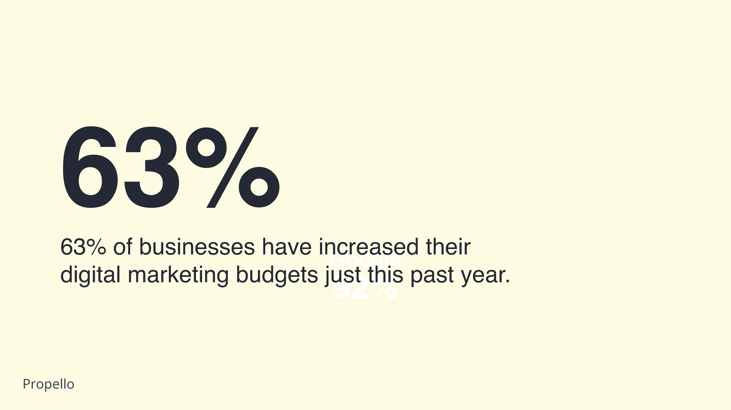
- 63% of businesses have increased their digital marketing budgets just this past year.

- Digital display is projected to grow at a 15.5% CAGR, while search is projected to grow at 12.2%. Search accounts for 40.9% of the global digital advertising and marketing market.
- PPC returns $2 for every $1 spent—resulting in a 200% ROI.
- According to the Bureau of Labor Statistics, marketing job demand is set to increase by 10% by 2026—above the average for all careers.
- Email marketing returns $36 for every $1 spent.
- Small businesses claim that email marketing is the marketing channel that brings them the highest return on investment.
- Over 20% of businesses say that the number of leads generated is the primary factor they base the success of their marketing channels on.
- Content marketing and SEO provide the best ROI according to marketers in this Databox.
- 72% of overall marketing budgets get put towards digital marketing channels.
- The average local business puts 5-10% of its revenue towards its digital marketing budget, but for larger businesses, that number can climb to about 14%.
- People spend 50% more with businesses that regularly respond to reviews.
- 93% of people read online reviews before making a purchase.
- Consumers can spend up to 5x longer on a site once they’ve interacted with bad reviews.
- Google holds 92% of the total worldwide search engine market share.

- 45% of shoppers buy online and then pick up in-store.
- Three-quarters of businesses are reporting on how their marketing campaigns are directly influencing overall revenue.
- 52% of businesses are using marketing attribution reporting.
- 62% of marketers use CRM software for reporting.
Email Marketing Statistics
In the realm of digital marketing, email remains a powerful tool for businesses to engage with their audience, drive conversions, and build lasting relationships.
In this section, we explore a collection of insightful email marketing statistics that highlight the effectiveness and impact of this marketing channel. From impressive return on investment (ROI) figures to the influence of personalization and automation, these statistics showcase the immense potential of email marketing in today's fast-paced digital landscape.
With billions of emails sent and received annually, businesses must understand the trends, preferences, and behaviors of email users to create successful campaigns.
Let us delve into the world of email marketing statistics and discover how businesses can leverage this powerful tool to connect with their target audience, drive conversions, and achieve marketing success.
- On average, email marketing has a 4400% ROI.
- Welcome emails have an average open rate of 82%.
- 91% of email users have unsubscribed from a company email they previously opted in to.
- 102.6 trillion emails are sent and received each year, and that number is rising.
- 49% of all emails are opened on mobile devices.
- 54% of all emails are classified as spam.
- Mobile users engage with emails the least out of tablet and PC users.
- 74% of marketers say targeted personalization increases customer engagement.
- 95% of companies using marketing automation are taking advantage of email marketing.
- The most opened emails related to hobbies, with an open rate of 27%.
- 49% of consumers say they would like to receive promotional emails from their favorite brands every week.
- Personalized emails get 6x Higher Transaction Rates, but only 30% of brands use them.
- 60% of consumers subscribe to a brand's list to get promotional messages and deals.
- Sending 3 abandoned cart emails results in 69% more orders than just one email which helps you reduce order form abandonment.
- 50% of small and medium-sized businesses use their marketing automation software to send email drip campaigns.
- When asked about GDPR, 88% of consumers who are willing to share personal information want transparency about how it's used.
- Email is nearly 40 times more effective in obtaining new customers than social media.
- An average email clickthrough rate is 6X that of average organic social media engagement.
- Automated emails get a 152% higher click-through rate and 70.5% higher open rates than manual emails.
- 58% of marketers in B2C companies use automated emails for marketing.
Social Selling Statistics
Social media has become more than just a platform for connecting with friends and sharing content. It has evolved into a powerful tool for businesses to drive sales and engage with their target audience.
This section explores a range of enlightening social selling statistics that highlight the impact and potential of leveraging social media for sales purposes.
With a staggering number of social media users worldwide and a significant portion of buyers conducting research through these platforms, it's clear that social selling has emerged as a vital strategy for sales professionals.
As we delve into this section, we uncover the immense potential of social selling in today's business landscape.
- 78% of salespeople using social media perform better than their peers.
- 98% of sales reps with 5000+ LinkedIn connections meet or surpass sales quotas.
- The outbound selling strategy of cold calling only has a 2.5% success rate.
- Thanks to implementing a social selling program, IBM boosted sales by 400%.
- There are 1.5 billion social media users across the globe.
- 77% of B2B purchasers won't speak to a salesperson until they've done their research.
- 55% of buyers do research via social media.
- Only 7% of respondents said that social selling was a priority for their sales organization.
- By the time a salesperson gets involved, up to 90% of the sales process could be completed by social selling.
- 87% of B2B buyers have a favorable impression of a salesperson if they were introduced to them through someone in their professional network.
- 84% of executives use contacts and info from social networks as part of their purchase process.
- 31% of B2B professionals sat that social selling allowed them to build deeper relationships with their clients.
- The social media marketing sector is worth $160 billion and is projected to reach $223 billion by the start of 2023.
- There are over 4.26 billion social media users globally.
- Businesses allocate around 15% of their marketing budget toward social media marketing
- Over 90% of brands do social media marketing.
- Facebook advertising is the most popular ad program globally.
- Nearly 86% of businesses on Facebook make use of its advertising platform.
- TikTok is the fastest-growing social media.
SEO Statistics
With Google processing an astonishing number of searches every second and a majority of clicks going to the top search results, it's clear that SEO is a vital strategy for businesses to capture organic traffic and gain a competitive edge.
However, it's worth noting that a significant percentage of web pages receive zero organic traffic, emphasizing the need for effective SEO practices and strategies.
As we delve into this section, we uncover the vast potential of SEO in driving website traffic, generating leads, and boosting conversions. From the power of content creation to the significance of organic traffic and the influence of search rankings, these statistics shed light on the key factors that contribute to SEO success.
- 72% of online marketers describe content creation as their most effective SEO tactic.
- Google receives over 77,000 searches per second.
- 67% of clicks go to the first 5 results displayed in search engines.
- 90% of web pages get zero organic traffic from Google.
- 50% of search queries are 4 words or more.
- 12% of search queries have a Featured Snippet box on Google.
- The SEO industry is worth over $50 billion in 2023.
- Organic traffic is responsible for 53% of traffic to all websites.
- Brands with a dedicated blog have a 55% more traffic rate than those that don't.
- 75% of people don't go beyond Google's first result page.
- Leads generated via SEO have a 15% closing rate.
- The #1 page on Google's search results has an average 32% click rate.
- The #1 page has 1500 words on it on average.
- Nearly 50% of businesses claim that SEO is their best ROI generator.
- 86% of people ignore paid advertisements.
- More than half (55%) of the world's internet traffic comes via smartphones.
- 92% of keywords have less than 10 searches each month.
- 25% of small business websites don't have an H1 tag.
Ecommerce Statistics
The world of ecommerce has witnessed remarkable growth, transforming the way people shop and creating vast opportunities for businesses worldwide.
In this section, we explore a range of insightful statistics that illuminate the evolving landscape of online retail. From website personalization and organic traffic dominance to consumer preferences and conversion rates, these statistics provide valuable insights into the factors driving success in the digital marketplace.
Lets us as we delve into the dynamic world of ecommerce, uncovering trends and highlighting key elements that shape the online shopping experience.
- In July 2020, Yieldify conducted research with 400 eCommerce leaders across the UK and the US.
- Here are some of their key findings:
- Over 74% of companies surveyed already have a website personalization program in place.
- In 2020, retention (58%) has overtaken conversion (55%) and acquisition (45%) as the key goal for website personalization.
- Only 54% currently use AI-driven predictive segments. However, this was identified as an area of high potential growth, as 89% expected to be using it by the end of next year.
- The three biggest obstacles that stand in the way of scaling a personalization strategy are A lack of expertise (37%), limited functionality (36%), and a lack of time (35%).
- 2.14 billion people, equivalent to 27% of the world's population, are shopping online.
- 69% of total eCommerce traffic comes from an organic source.
- 60% of Millennials will visit Amazon.com before making a purchase online.
- People trust product reviews from their friends and family 80% of the time.
- Ecommerce websites have a conversion rate of 2.90%
- Shopify has the most out of 24 million e-commerce websites globally, with 5.6 million.
- 64.7% of online shoppers prefer to buy products that have content written in their mother tongue.
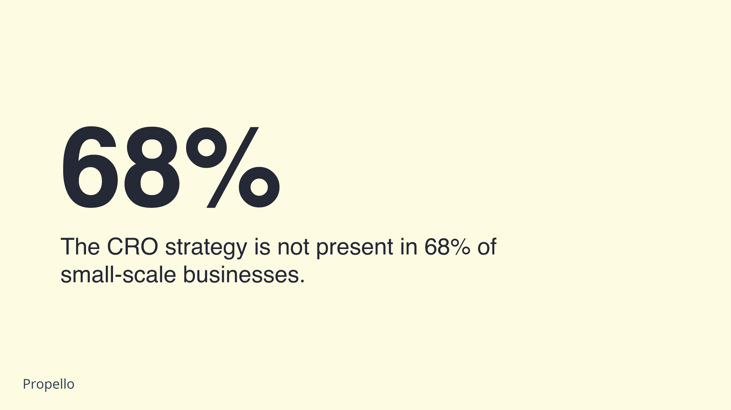
- The CRO strategy is not present in 68% of small-scale businesses.

Landing Pages
Landing pages play a pivotal role in capturing the attention and driving the desired actions of website visitors. As a crucial component of any digital marketing strategy, the effectiveness of landing pages can make a significant difference in generating leads and achieving conversion goals.
In this section, we explore the power of landing pages through a series of compelling statistics. These statistics highlight key factors that can impact the performance of landing pages and provide valuable insights for optimizing their effectiveness.
- Companies with 30 or more landing pages generate 7 times more leads than those with fewer than 10. Source: HubSpot, 2022
- On average, using videos on landing pages increases conversions by 86%.
- Companies that have over 40 landing pages typically generate 12x more leads than ones with 1 to 5 landing pages.
- Adding videos to landing pages can improve conversions by up to 86%.
- Only 22% of businesses are satisfied with their conversion rates.
Infographics
In the fast-paced world of digital marketing, grabbing and retaining the attention of your target audience is essential. Visual content has emerged as a powerful tool to convey information effectively and engage users in a visually appealing manner.
In this section, we explore the world of infographics and their impact on content marketing strategies. The statistics we present shed light on the widespread adoption of infographics, their influence on social media engagement, and their effectiveness as a content format.
- 65% of B2B marketers are creating infographics.
- Infographics are shared 3x more than any other visual content on social media.
- 40% of marketers site original graphics, like infographics, as their best-performing content.
- 41.5% of marketers state that infographics and unique visuals are the most engaging form of content.
Influencer Marketing Statistics
In the dynamic landscape of digital marketing, influencer marketing has emerged as a powerful strategy to connect with audiences and drive brand awareness. Collaborating with influencers allows businesses to tap into their established credibility, reach, and engaged followers to promote products or services.
In this section, we explore influential marketing statistics that highlight the growing importance and effectiveness of this marketing approach.
- Influencer marketing is yet another crucial part of Digital Marketing. This set of influencer marketing statistics will help you understand why your business needs to start investing in influencers ASAP!
- The influencer marketing sector is worth $14 billion.
- Influencer marketing has an ROI of 650% as marketers get $6.5 for every $1 invested.
- Influencer marketing has surpassed print advertising in effectiveness
- Nearly 56% of marketers from the United States and the United Kingdom use Instagram to collaborate with influencers
- Micro-influencers are more popular than mega-influencers among marketers.
- By 2028, the Influencer marketing industry will be worth $85 billion.
Future of Digital Marketing Statistics
- It is predicted that 69% of the overall advertisement spending will be generated via smartphones. Be sure to optimize your social media campaigns for smartphones!
- 90% of mobile users are not aware of what they want to purchase, So they look for it online, make sure you optimize your digital marketing campaigns for the ever-increasing mobile users.
- Over 50% of digital marketers will increase their content marketing budget in 2023, as per the marketing insider group.
- Augmented Reality is the new big thing in the marketing sector. Market Research Future (MRFR) predicts that the worldwide augmented reality market is estimated to reach $461.25 billion by 2030. These predictions were based on the CAGR of the sector, which is 41.50%.
- 61% of shoppers prefer to shop from businesses that have augmented reality offerings.
- Voice search is another thing to look at, Google found out that over 50% of baby boomers use voice assistants as a way to get information on the go.
Source
demandsage.com, Wordstream, PRNewswire, Statista, Google Economic Impact, Hubspot, Search Engine Journal, wpforms.com


